
How to Quantify Marketing Efforts That Drive Revenue


Are you making smarter marketing decisions—or just guessing? In 2025, over half of marketers plan to cut ad spend, yet most aren’t tracking both digital and traditional channels together.
That’s a risky move. Without knowing how to quantify marketing efforts using the right performance metrics and analytic tools, your campaigns could be costing more than they’re worth.
If you’re ready to align your digital marketing strategy with what truly moves the needle for your target audience, it’s time to stop guessing and start measuring.
Learn which key performance indicators reveal real results—and how to optimize future campaigns with confidence.
Key Takeaways:
Start with What You’re Actually Earning

Before you start tweaking channels or picking KPIs, you need to know what success looks like in dollars and cents. That’s where Marketing ROI comes in.
How ROI Really Works in Marketing
Marketing ROI isn’t just a finance metric, but also, it’s your credibility metric.
At its core, it tells you how much revenue your marketing efforts generate compared to what you spent.
Think of it like this: if you put $10,000 into a campaign and it brings in $30,000 in revenue, your ROI is 200%.
That number doesn’t just sound good in a meeting–it’s the evidence that your strategy is paying off.
But here’s the catch: ROI can’t live in a vacuum. It only works when you tie campaigns directly to business outcomes.
That means setting clear revenue-linked goals before you launch anything, and tracking actual performance, not just engagement metrics.
Oracle puts it plainly: marketing ROI quantifies how your campaigns generate actual revenue. It’s not about fluff. It’s about proving your work makes money.
Why You Should Care (More Than You Probably Do)
If you’re still basing marketing decisions on likes, impressions, or gut instinct, you’re probably wasting budget. ROI pulls you out of the guessing game.
According to Salesforce, ROI helps you pinpoint which channels are making you money and which ones are draining it.
It shows you where to double down and where to pull back–fast.
That kind of clarity doesn’t just save dollars, it builds trust with leadership and helps you scale smarter.
Bottom line: marketers who understand ROI aren’t just better at reporting results. They’re better at getting them.
Setting Goals and Objectives That Actually Mean Something
Before you start tracking performance, you need to define what “good” looks like, which has to match your business goals, not just marketing trends.
Not every metric deserves your attention. Some are helpful for brand awareness, others for bottom-line revenue.
Knowing the difference keeps your reports focused and your strategy sharp.
Here’s a breakdown of the most useful KPIs, when to use them, and how they’re calculated:
| KPI | Purpose | When to Use | Formula |
|---|---|---|---|
| Impressions | Track reach/visibility | Brand awareness campaigns | Total number of views |
| Search Engine Rankings | Monitor SEO performance | Organic content and web traffic | Position of page for target keywords |
| Click-Through Rate (CTR) | Measure engagement | Ads, email, CTAs | (Clicks ÷ Impressions) × 100 |
| Cost per Click (CPC) | Understand ad efficiency | Paid campaigns (PPC) | Total Ad Spend ÷ Number of Clicks |
| Conversion Rate | Track how many actions are taken | Landing pages, CTAs, email signups | (Conversions ÷ Visitors) × 100 |
| Customer Acquisition Cost (CAC) | See how much it costs to gain one customer | Any campaign tied to new customer growth | Total Spend ÷ New Customers Acquired |
| Customer Lifetime Value (CLV) | Predict revenue per customer | Subscription models, long-term sales cycles | Avg. Order Value × Purchase Frequency × Avg. Retention Time |
| Lead-to-Customer Rate | Track sales funnel health | Lead nurturing and sales-focused campaigns | (New Customers ÷ Total Leads) × 100 |
| Return on Ad Spend (ROAS) | Measure paid campaign profitability | Ad campaigns | Revenue from Ads ÷ Cost of Ads |
| Attribution Modeling | Understand which touchpoints drive conversion | Multi-channel campaigns | Varies (e.g., linear, time decay, last click, etc.) |
Remember, you don’t need to track all these at once… just the ones tied to your objectives. The rest? Well, a complete noise.
Tie the Numbers to What Actually Matters

A campaign that boosts clicks but doesn’t move revenue is a distraction.
HBR calls it out clearly–aligning marketing to business goals means your work supports things like revenue growth, long-term customer value, and strategic priorities.
So before launching anything, ask: Does this support our growth targets? Not just traffic. Not just leads.
Actual business goals. When marketing lines up with the bigger picture, ROI doesn’t just improve; it actually matters.
Pick Tools That Actually Show You Something
If you’re measuring ROI, but your data lives in five places and none of them agree, the problem isn’t your marketing; it’s your stack.
Here’s a breakdown of tools worth using (not just for collecting data), but for actually understanding it.
| Tool | Benefits | When to Use | Pricing |
|---|---|---|---|
| Google Analytics 4 | Tracks user behavior across channels | Website + app tracking | Free |
| HubSpot Marketing Hub | Combines CRM + marketing automation | Lead generation, nurturing | Price varies depending on the services you want to avail |
| Salesforce Marketing | Strong enterprise CRM + campaign tracking | Large orgs with complex pipelines | Starter Suite – $25/user/month Marketing Cloud Growth Edition – $1,500/org/month Marketing Cloud Advanced Edition – $3,250/org/month |
| Tableau | Advanced data visualization | Enterprise-level reporting | Enterprise Viewer – $35/user/month Enterprise Explorer – $70/user/month Enterprise Creator – $115/user/month |
| Looker Studio | Custom dashboards from multiple sources | Data blending and reporting | Free Standard Edition – $5,000/month Enterprise Edition – Call Sales Emded Edition – Call Sales |
| SEMrush | SEO + competitive analysis | Organic and paid search campaigns | Pro – $139.95/month Guru – $249.95/month Business – $499.95/month |
| Ruler Analytics | Tracks multi-touch attribution + revenue | Full-funnel attribution | Small Business – £179/monthMedium Business – £584/month Large Business – £999/month Advanced – £POA |
| Kissmetrics | Behavioral tracking for conversion optimization | SaaS and eCommerce | Request Demo |
| Cyfe | All-in-one dashboard builder | Aggregating cross-channel metrics | Starter – $29/month Standard – $39/month Pro – $65/month Premier – $119/month |
| Sprout Social | Social media analytics and publishing | Social-focused campaigns | Standard – $199/per seat/month Professional – $299/per seat/month Advanced – $399/per seat/month Enterprise – Custom Pricing |
Turn Data Into Something You Can Actually Use
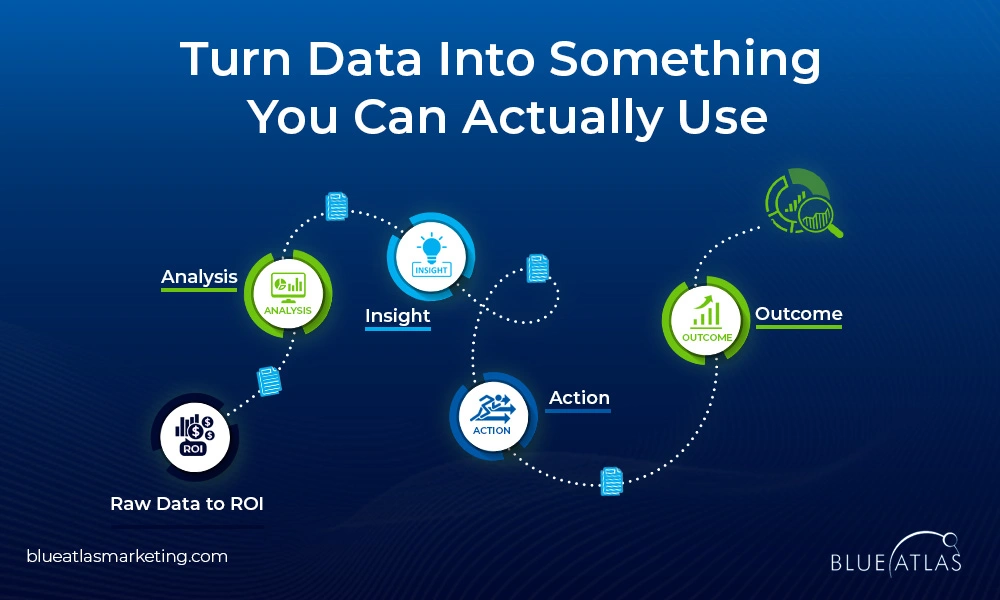
You’ve got numbers. Now what? Raw data is just noise unless you know how to break it down and use it to make smart calls.
How to Break Down Marketing Data (Without Guessing)
Here’s a focused, seven-step process to actually extract insights that can improve your marketing, not just fill your reports.
Step 1: Attribution Modeling – This tells you which parts of your marketing deserve credit for a conversion.
Use models like first-touch, last-touch, or multi-touch to understand what’s really working across the funnel.
Step 2: A/B Testing – Don’t change everything at once. Test one variable (headline, CTA, form length) at a time and use the results to guide creative or UX decisions.
Step 3: Regression Analysis – Want to know what’s influencing conversions–email sends, ad clicks, or timing?
Regression analysis helps you connect the dots between variables and outcomes.
Step 4: Cohort Analysis – Group users by behavior, time, or channel and analyze how they act over time.
It reveals patterns you’d miss in average data, like when churn typically starts or which cohort sticks longest.
Step 5: Predictive Analytics – Use historical data to forecast outcomes–which users are likely to convert, which campaign will likely underperform, and where to shift the budget before a dip happens.
Step 6: Marketing Mix Modeling (MMM) – This method looks at all your channels together (online and offline) and tells you which combination gives the best results.
It’s slow to set up but powerful for media planning.
Step 7: CLV vs. CAC Ratio – This ratio keeps your spending honest. If your customer acquisition cost is higher than their lifetime value, you’re burning cash. The sweet spot is at least 3:1.
Read the Data Before Making the Call
As Samhub puts it: Smart marketing decisions come from insights, not instincts.
Once you’ve analyzed your campaigns, use that data to steer budget, shift messaging, or kill underperforming tactics.
This is how you turn measurement into momentum and how ROI stops being a buzzword and becomes a benchmark.
Stop Guessing, Start Tweaking What Actually Works
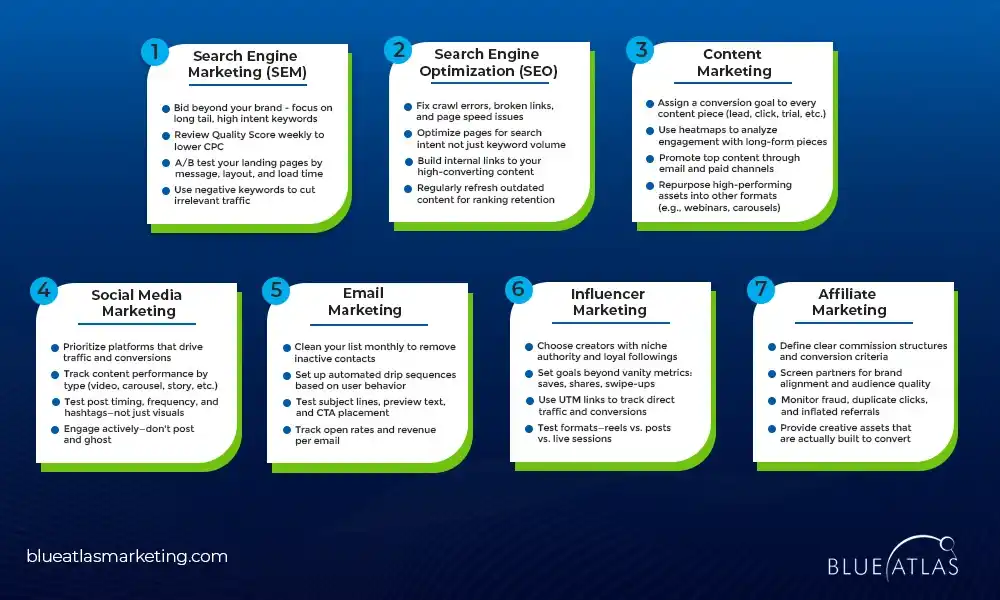
Most teams don’t need more channels; they need to squeeze more from the ones they already use. ROI improves when your tactics stop working in silos.
Where to Tune Your Marketing Channels for Better ROI
Search Engine Marketing (SEM)
- Bid beyond your brand — focus on long-tail, high-intent keywords
- Review Quality Score weekly to lower CPC
- A/B test your landing pages by message, layout, and load time
- Use negative keywords to cut irrelevant traffic
Search Engine Optimization (SEO)
- Fix crawl errors, broken links, and page speed issues
- Optimize pages for search intent, not just keyword volume
- Build internal links to your high-converting content
- Regularly refresh outdated content for ranking retention
Content Marketing
- Assign a conversion goal to every content piece (lead, click, trial, etc.)
- Use heatmaps to analyze engagement with long-form pieces
- Promote top content through email and paid channels
- Repurpose high-performing assets into other formats (e.g., webinars, carousels)
Social Media Marketing
- Prioritize platforms that drive traffic and conversions
- Track content performance by type (video, carousel, story, etc.)
- Test post timing, frequency, and hashtags — not just visuals
- Engage actively — don’t post and ghost
Email Marketing
- Clean your list monthly to remove inactive contacts
- Set up automated drip sequences based on user behavior
- Test subject lines, preview text, and CTA placement
- Track open rates and revenue per email
Influencer Marketing
- Choose creators with niche authority and loyal followings
- Set goals beyond vanity metrics: saves, shares, swipe-ups
- Use UTM links to track direct traffic and conversions
- Test formats — reels vs. posts vs. live sessions
Affiliate Marketing
- Define clear commission structures and conversion criteria
- Screen partners for brand alignment and audience quality
- Monitor fraud, duplicate clicks, and inflated referrals
- Provide creative assets that are actually built to convert
Adapt or Watch the Numbers Stall
Even good campaigns die fast if they stay static. Market conditions shift. Audience expectations move. Competitors copy you.
That’s why testing is not a one-time thing and why adaptability matters more than getting it “right” the first time.
As Vizologi pointed out, the teams that win are the ones who learn fast and iterate faster.
Maybe that means changing your offer, repositioning the value prop, or adjusting spend mid-campaign.
Smart marketers don’t wait until Q4 to fix what’s failing in Q2.
Frequently Asked Questions (FAQs)
How do you calculate marketing ROI?
(Revenue – Cost of Marketing) ÷ Cost of Marketing × 100.
This formula helps assess marketing campaigns using analytics tools and key performance indicators aligned with your target audience’s behavior and conversion goals.
What’s a good ROI in marketing?
A 5:1 return is excellent—it indicates strong marketing performance, efficient CPA management, and content that achieves a high CTR with the intended audience.
How often should I review my metrics?
Evaluate weekly to track campaign-level KPIs and monthly for broader insights. This rhythm supports digital marketing success and helps optimize AI-driven strategies and social media channels.
Can ROI be measured without revenue data?
No—revenue data is essential for connecting your strategy to actual results. Without it, calculating conversion rate or gauging true performance becomes unreliable.
What tools help with marketing ROI?
Top analytics tools like Google Analytics 4, Looker Studio, and Ruler Analytics monitor campaign metrics, measure success, and inform future tactics based on smart insights.
Knowing how to quantify marketing efforts is the difference between guessing and growing. With the right KPIs, tools, and focus, you can measure marketing campaign success, connect actions to total revenue, and turn a lot of data into smarter decisions.
When you target potential customers with precision and prove what’s working, marketing becomes a profit driver—not an expense.
Ready to turn your marketing data into real results?
Let Blue Atlas help you track smarter, spend your budget wisely, and prove the true impact of your marketing.
Contact us today and start transforming data into ROI.