
2025 Industrial Trade Show ROI Benchmark & Comparison Report™
See How Your Exhibitor Performance Stacks Up, and Where Most Companies Are Losing 40–70% of Revenue Potential
A data-informed analysis for industrial & manufacturing companies attending trade shows in 2025.
Discover how exhibitors actually performed, where leads disappear, and what top performers do differently.
What You’ll Learn
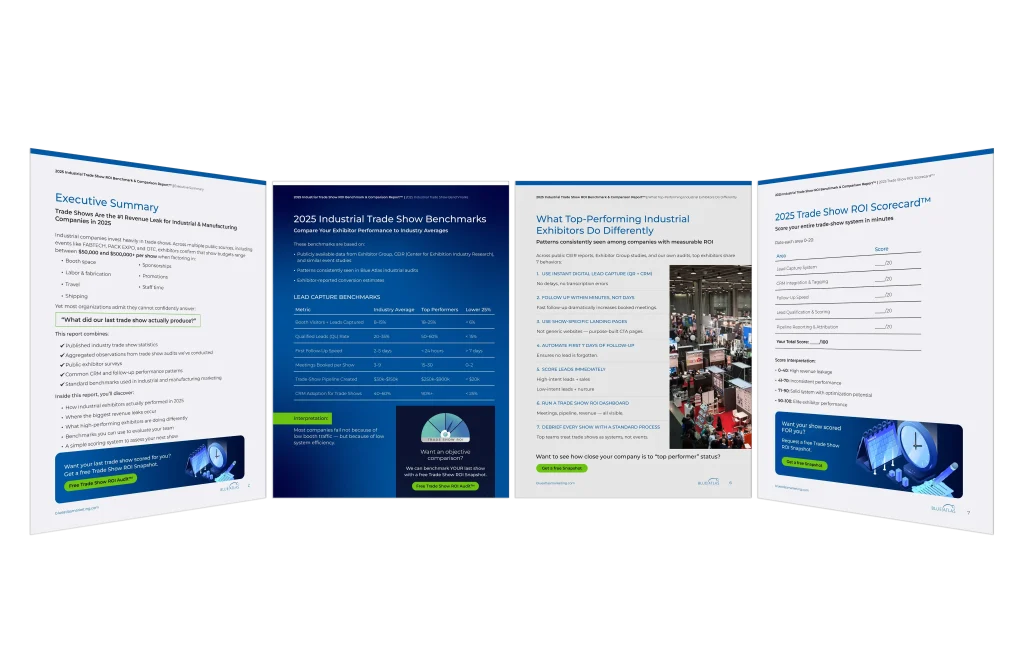
Industry Benchmarks for Trade Show ROI
Based on public exhibitor surveys, CEIR research, and aggregated trade show audit findings.
The 7 Biggest Revenue Leaks at Industrial Trade Shows
Why most companies lose 40–70% of their potential revenue after the show.
Where You Stand Compared to Other Industrial Exhibitors
Lead capture, follow-up speed, qualification, CRM usage, and attribution benchmarks.
The Trade Show ROI Scorecard™
Evaluate your performance across five critical categories in minutes.
What Top Exhibitors Do Differently
The hidden systems used by high-performing industrial companies in 2025.
The Cost of Inaction
How much pipeline is lost when trade show systems aren’t optimized.
Why This Report Matters
Industrial & manufacturing companies invest heavily in trade shows:
But publicly available exhibitor research shows:
This report quantifies the true opportunity — and exposes where revenue is leaking.
Who This Is For
This report is ideal for:
At companies between $5M and $100M in annual revenue who attend 3–6+ shows per year.
What Happens After You Download
You’ll receive:
Ready to see how your company compares?